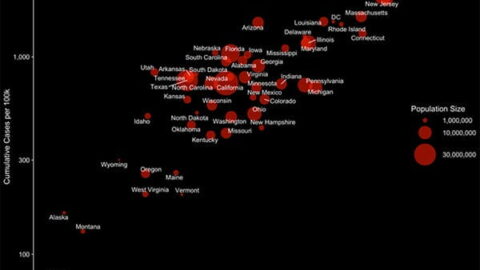
Novel animated graphic illustrates lag time between COVID-19 cases and deaths in United States
A Harvard Pop Center working paper presents state-level data on COVID-19 cases and deaths (spanning from January 22 until July 8, 2020) in one animated graphic that helps to illustrate the lag time between cases and deaths. The visualization helps to…